Case study for using CASTpFold to analyze pockets and cavities of molecules


1. Protein topography: pocket, cavity (void), and cross channels

Fig 1: The concave regions identified on protein structures. (A) Protein surfaces contain three types of concave regions: ① an accessible surface pocket with a narrowed entrance, indicated by a dashed line; ② a completely enclosed cavity (void) lacking an entrance; and ③ a shallow depression. (B) A surface pocket supported by atoms in grey as identified by CASTpFold, which exhibits kinase activity (GO:0016301, Pocket ID: 2, style: “surface”) in the AF2-predicted structure (AF2 ID: A0A2N0QT79). (C) A channel highlighted in red in the outer membrane protein (PDB ID: 5BUN, Pocket ID: 1).

CASTpFold provides detailed quantitative analysis of geometric and topological properties of protein structures, including pockets (AF2 ID: A0A2N0QT79 Fig 1B), interior cavities (no mouth), and cross channels(PDB ID: 5BUN Fig 1C).

Fig 2: Surface pockets and protein-protein interface pockets: (A) Two surface pockets identified on the AF2-predicted structure (AF2 ID: A0A0C3Q0M4, Pocket IDs: 1 in lime and 2 in red). They are collectively predicted to carry out kinase activity; (B) A member of a PPI pocket cluster (cluster size: 294), located at the interface of the SARS-CoV-2 Spike/ACE2 Complex (PDB ID: 6M0J, Pocket ID: 1)

In the "Pocket Similarity" panel, CASTpFold measures the similarity among the database of surface pockets and protein-protein interface (PPI) pockets. An exmaple of surface pocket is shown in Fig 2A (AF2 ID: A0A0C3Q0M4), and a PPI pocket is shown in Fig 2B (PDB ID: 6M0J).


2. Case study: AF2 structure(A0A2N0QT79)

Fig 3: The server displays data on pocket surface area, volume, and detailed information on atoms contributing to the pocket. Here the second pocket is highlighted in “cartoon” style.

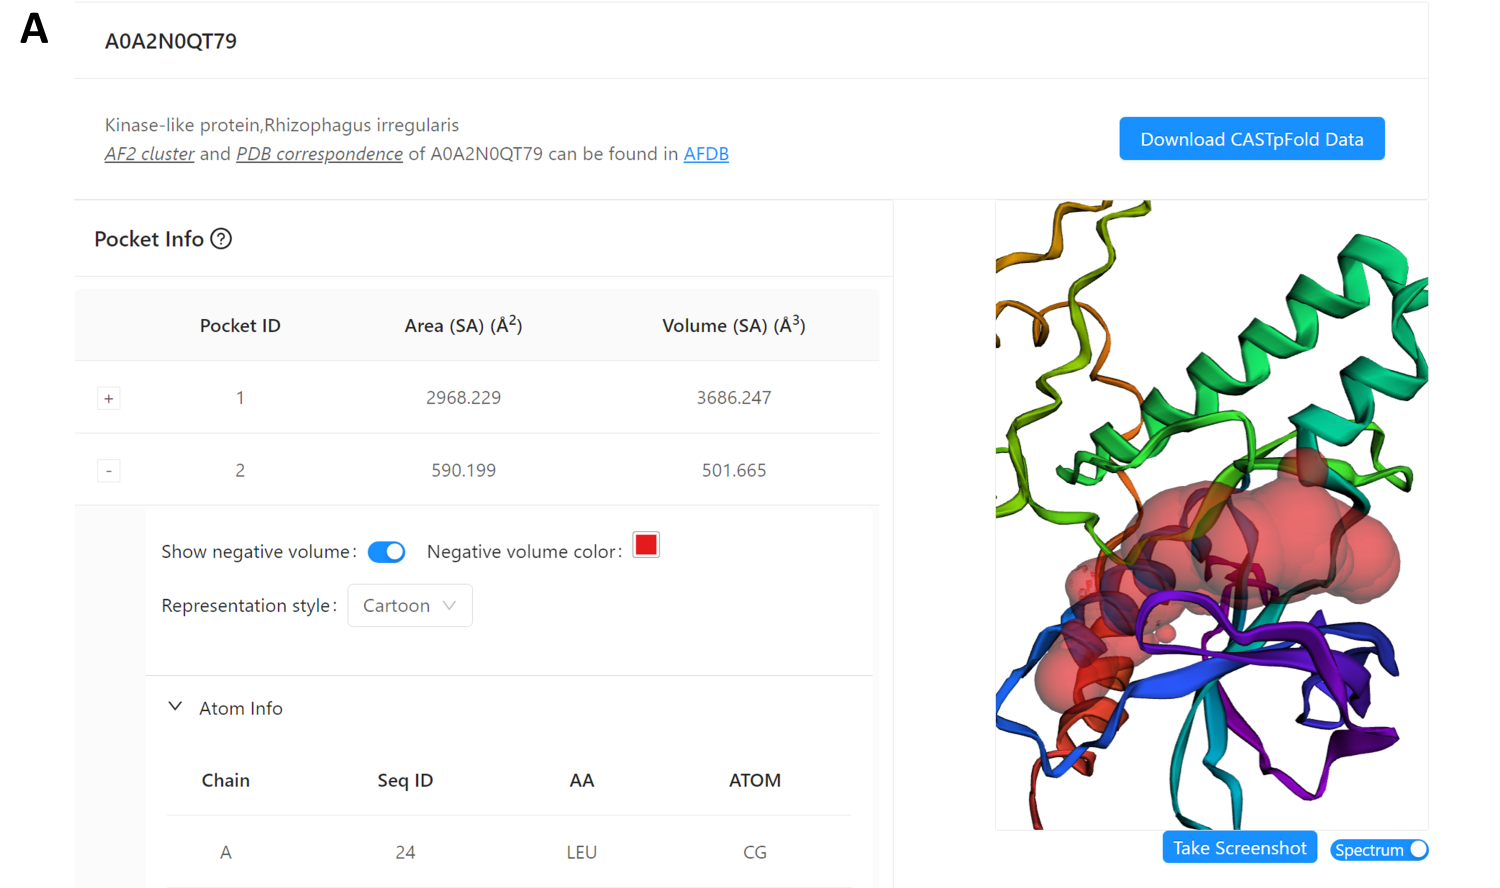
In Fig 3, the “Basic Info” panel for a AF2 predicted protein (AF2 ID: A0A2N0QT79) displays information from the UniProt database. The “Pocket Info” panel depicts the selected pocket (Pocket ID: 2), which is rendered in cartoon style in the “Structure viewer” panel. Additionally, an expandable “Atom Info” panel reveals the atomic details of the selected pocket. Users can identify the residue positions within the structure in the viewer by clicking the corresponding row.

Fig 4: The sequence panel presents information on atomic contributions and annotations of residues along the sequence. Here the residue “N162” and its atoms contributing to the pocket formation are listed (Pocket ID:2), which is visulzied as cyan spheres in the viewer.

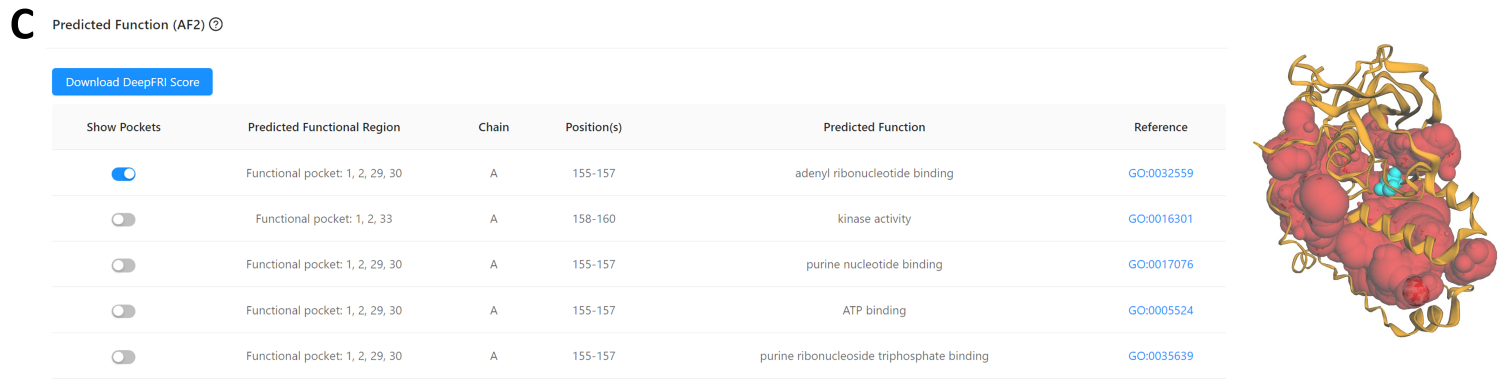
Fig 4 shows the “Sequence Info” panel for the structure (AF2 ID: A0A2N0QT79), including pocket residue with atom information, which is visualized as cyan spheres in the viewer.

Fig 5: The predicted function panel displays functional pockets in AF2 structures linked to relevant GO terms or EC numbers, with the predicted functionally relevant positions with cyan spheres, their corresponding chains in orange, and the pockets in red for combined viewing.

Users exploring the AF2-predicted structure (AF2 ID: A0A2N0QT79) can find a “Predicted Function” panel (Fig 5), which lists the predicted function of the pocket, including the associated GO terms or EC numbers, functionally relevant positions, and links to details of potential functions. Users can download the corresponding DeepFRI prediction score using the "Download DeepFRI Score" button.

Fig 6: The pocket similarity panel offers a list of pockets from other proteins similar to the query pocket, for both AF2 and PDB structures

Fig 6 shows a pocket from an the structure (AF2 ID: A0A2N0QT79, Pocket ID: 2) that has a total of 93 pockets across both PDB and AF2 structures exhibiting similarity to the queried pocket. One of these is from the PDB structure (PDB ID: 7NQQ, Pocket ID: 1), which is visualized in the “Similar pocket viewer”.

3. Case study: PDB structure(6M0J)

Fig 7: Basic information of 6M0J with surface area, volume, and detailed atoms contribution to the pocket. Here the first pocket is highlighted in “cartoon” style.

In Fig 7, the “Basic Info” panel for a PDB structure (PDB ID: 6M0J) displays information from the UniProt database. The “Pocket Info” panel depicts the selected pocket (Pocket ID: 1), which is rendered in cartoon style in the “Structure viewer” panel.

Fig 8: The sequence panel displays detailed information about atomic contributions and annotations for each residue. For example, the residue 'N437' shows its associated annotations and resideus that contribute to pocket formation (Pocket ID:1). These contributions are visualized as cyan spheres within the viewer.

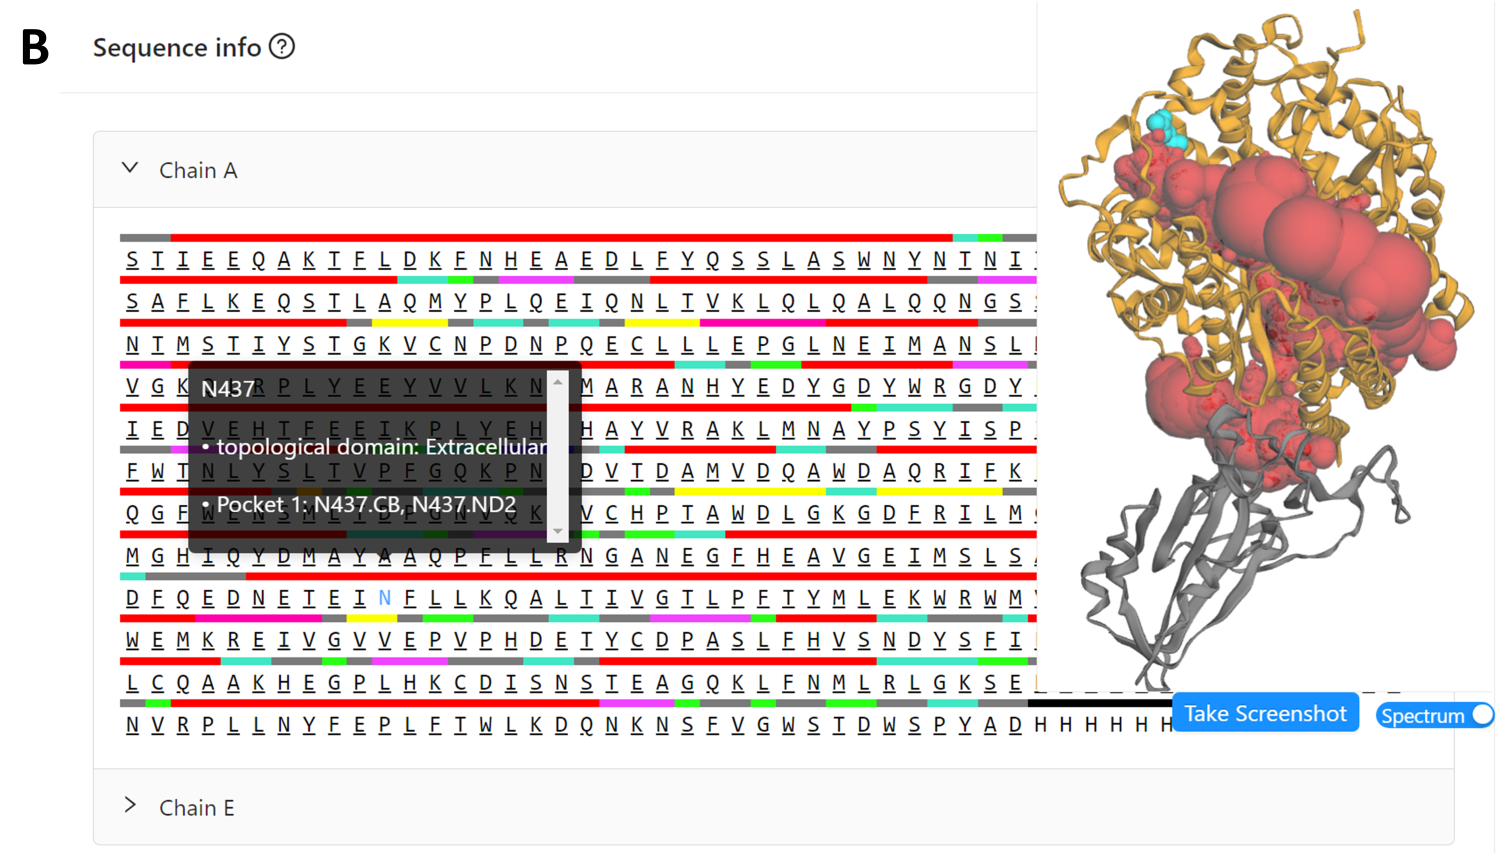
Fig 8 shows the “Sequence Info” panel for the PDB structure (PDB ID: 6M0J), including annotation and pocket residue with atom information, which is visualized as cyan spheres in the viewer.

Fig 9: The annotation panel displays UniProt-sourced annotations for PDB structures, highlighting annotated residues, their respective chains, and their relevant pockets in cyan, orange, and red, respectively.

In Fig 9, an “Annotation” panel is available for PDB structures, providing annotations extracted from the UniProt database. PDB annotated residues can be visualized together with their respective pockets in a combined view. Here, pockets 1, 28, and 45 are visualized alongside the annotated residues spanning from 30 to 41.

Fig 10: The pocket similarity panel oprovides a list of pockets from other proteins that resemble the query pocket(PDB ID: 6M0J). It features a total of four pockets containing at least 14 residues. Among these, two pockets have non-zero members in their respective clusters: Pocket 1 on chain A has 294 similar members, while chain E has 2 members.

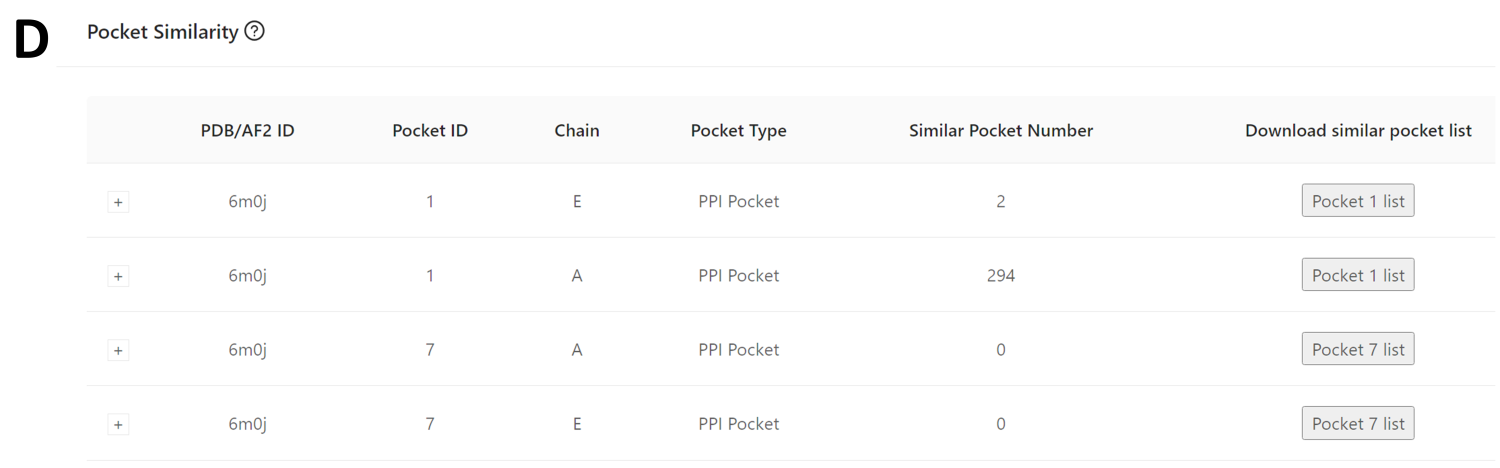
Fig 10 presents four pockets containing at least 14 residues identified within the PDB structure (PDB ID: 6M0J). Among these, two pockets have a nonzero number of similar members: Pocket 1 on chain A boasts 294 similar members, and chain E includes 2 members.

Fig 11: The “PDB counterpart” panel shows the AF2 counterpart of all subunits of the query PDB structure, where the corresponding Uniport ID is mapped to its AF2 representative entry, and users can perform a detailed comparison by exploring the details of the AF2 counterpart by opening the counterpart link.

The 'PDB counterpart' panel facilitates the comparison between PDB entries and their AF2 counterparts. Users can compare PDB subunits with their corresponding AF2 structures by clicking the relevant link. Figure 11 illustrates that chain A of the PDB structure (PDB ID: 6M0J) corresponds to UniProt ID: Q98YF1, which is mapped to the AF2 predicted representative structure (AF2 ID: (PDB ID: A0A7R9PMA8)). Conversely, chain E corresponds to UniProt ID: P0DTC2, which cannot be mapped to any AF2 predicted representative structure.